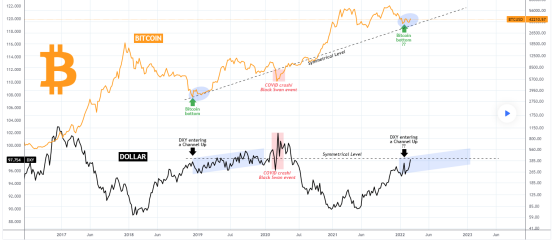
On this chart I've plotted Bitcoin against the U.S. Dollar Index ( DXY ) on the 1W time-frame. It is a simple comparison of time phases.
As you see, the DXY (black line) has reached in recent weeks a symmetrical level which during 2019 it started forming a Channel Up. At the same time Bitcoin (orange line) made the bottom of its 2018 Bear Cycle and started the new Bull Cycle.
Right now the pattern formed on Bitcoin is very similar to that of the December 2018 - January 2019 Bear Cycle bottom. I have made a case in previous publications that Bitcoin may be in a mini (I called it in fact the 'smoothest' ever) Bear Cycle since the April 2021 High. Now that seems to be very consistent with that fractal comparison on DXY .
Do you think the symmetrical pattern that DXY is forming may be an indication that BTC has bottomed?
Comments
0 comments
Please sign in to leave a comment.